This is a basic notebook example
First we create a numpy random matrix
import numpy as np

matrix = np.random.rand(10,10)
matrix
array([[0.96567651, 0.30506902, 0.32257505, 0.18142226, 0.56523866,
0.22559288, 0.12187457, 0.29348018, 0.07512893, 0.60690278],
[0.99120588, 0.97747109, 0.57060405, 0.80508133, 0.69893977,
0.04962192, 0.38932533, 0.92847244, 0.44660084, 0.12310775],
[0.91112615, 0.64399547, 0.60032823, 0.6472709 , 0.55687736,
0.14210576, 0.3809531 , 0.05695052, 0.85103143, 0.81268179],
[0.98030305, 0.53510841, 0.01689351, 0.96312295, 0.10572189,
0.73932479, 0.89132214, 0.26954746, 0.28492171, 0.98389969],
[0.98325582, 0.65008127, 0.58742883, 0.90843466, 0.03929431,
0.95377973, 0.15449726, 0.85750516, 0.20994241, 0.60891718],
[0.87263503, 0.90202262, 0.36656352, 0.50325479, 0.96004202,
0.97845724, 0.95077854, 0.65138685, 0.80181714, 0.75102247],
[0.5259874 , 0.42256346, 0.28858963, 0.53442906, 0.85809684,
0.64872734, 0.81881669, 0.59914393, 0.70237029, 0.48598182],
[0.88675751, 0.11554934, 0.46484857, 0.58960018, 0.24134456,
0.80328331, 0.15986939, 0.29336976, 0.26876273, 0.04455668],
[0.66591832, 0.55973957, 0.31876551, 0.18314654, 0.06622743,
0.67067428, 0.38405475, 0.20078656, 0.91106437, 0.66022945],
[0.8247596 , 0.81160209, 0.02256476, 0.06387229, 0.79706914,
0.87229998, 0.47652461, 0.19314127, 0.53832423, 0.66134474]])Convert it into a pandas dataframe
import pandas as pd

df_matrix = pd.DataFrame(matrix)
df_matrix
Loading...
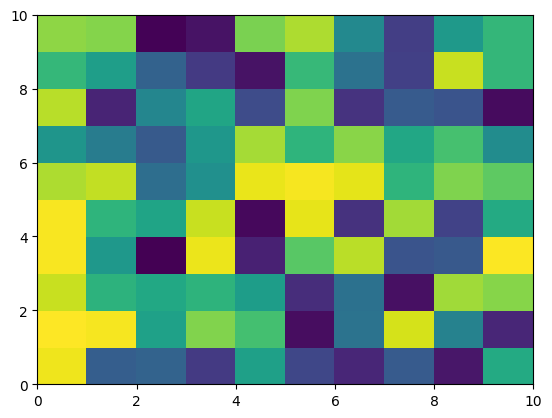
Plot a heatmap
%matplotlib inline
import matplotlib.pyplot as plt

plt.pcolor(df_matrix)
plt.show()