
First usage of Python libraries#
Most Python code uses third party libraries. During this course, we will learn how to install such libraries and how to use few popular third party libraries. However, during all the first chapters to learn Python, we won’t use such libraries.
In this notebook, we show few examples of nice and simple things that can be done with few popular libraries.
Matplotlib example#
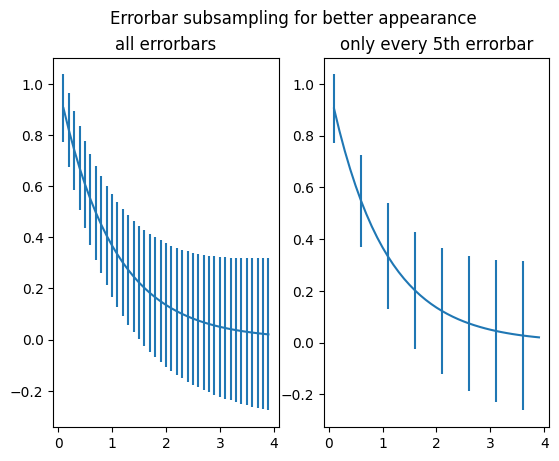
Let us start with a simple Matplotlib/Pandas plot (taken from the Matplotlib gallery, https://matplotlib.org/3.1.1/gallery/lines_bars_and_markers/errorbar_subsample.html).
import numpy as np
import matplotlib.pyplot as plt

# example data
x = np.arange(0.1, 4, 0.1)
y = np.exp(-x)

# example variable error bar values
yerr = 0.1 + 0.1 * np.sqrt(x)

# Now switch to a more OO interface to exercise more features.
fig, axs = plt.subplots(nrows=1, ncols=2, sharex=True)
ax = axs[0]
ax.errorbar(x, y, yerr=yerr)
ax.set_title("all errorbars")

ax = axs[1]
ax.errorbar(x, y, yerr=yerr, errorevery=5)
ax.set_title("only every 5th errorbar")

fig.suptitle("Errorbar subsampling for better appearance");
Vega-Altair example#
We now switch to another example using another plotting library Vega-Altair, more oriented on producing interactive web plots.
import altair as alt

# load a sample dataset as a pandas DataFrame
from vega_datasets import data
cars = data.cars()

# make the chart
alt.Chart(cars).mark_point().encode(
    x="Horsepower",
    y="Miles_per_Gallon",
    color="Origin",
).interactive()
Ipyleaflet example#
Finally, we show a last example using ipyleaflet:
from ipyleaflet import Map, Marker

center = (52.204793, 360.121558)
map = Map(center=center, zoom=12)

# Add a draggable marker to the map
# Dragging the marker updates the marker.location value in Python
marker = Marker(location=center, draggable=True)
map.add_control(marker)

display(map)
# We can also update the marker location from Python
marker.location = (52.2, 360.1)
# We can run a python function when the marker location changes
# Here we'll adjust the center of the map to follow the marker
def on_location_changed(value):
    map.center = value.new


# Call the on_location_changed function when marker.location changes
marker.observe(on_location_changed, "location")